Senior Housing Occupancy Increases in Fourth Quarter 2021
January 6, 2022
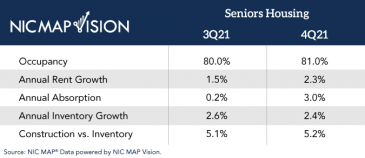
Senior housing occupancy increased for the second consecutive quarter and rose to 81.0% in the fourth quarter of 2021 in the Primary Markets, a 1.0 percentage point increase from the third quarter and a 2.3 percentage point increase from a pandemic-related low of 78.7% in the second quarter, according to new NIC MAP® data, powered by NIC MAP Vision. The data do not appear to show any significant impact from the COVID-19 Delta variant on occupancy. Impact from the Omicron variant may not be known until the first quarter of 2022.
“Fourth quarter occupancy is often negatively affected by seasonal illnesses like the flu, but occupancy continued to increase despite the challenges posed by the Delta variant,” said Beth Burnham Mace, chief economist for NIC. “The data suggest that infection and safety protocols put in place during the first phase of the pandemic are keeping residents safe and driving continued move-ins into the properties by new residents. These conditions, as well as relatively limited near-term inventory growth, should continue to help senior housing bounce back from pandemic-related occupancy losses.”
Pent-up demand, a modest increase in supply, and slow construction starts in 2020 contributed to the occupancy increase in the second half of 2021, according to National Investment Center for Seniors Housing & Care (NIC) experts. Demand increased by 21,029 units in NIC MAP’s Primary Markets in the third and fourth quarters, the strongest two-quarter unit increase since NIC MAP Vision began reporting the data in 2005. Inventory increased by 6,687 units—the smallest two-quarter unit count increase since 2015. Construction activity remained subdued, which supported continued moderate gains in inventory growth. There were 35,340 units under construction in the fourth quarter of 2021, just slightly more than in the 3rd quarter, which was the weakest pace since 2015.
Rental rates rose across NIC MAP’s Primary Markets by 2.3%, which can be at least partially attributed to higher operating and overhead costs. Sixty-seven percent of NIC’s Executive Survey Insights respondents supported higher wages to address staff shortages, though many acknowledged longer-term solutions that help retain staff and reduce expenses are needed.
“Competition for workers is fierce and is pressuring wage growth which, along with other escalating costs, has contributed to strained operating margins,” said NIC’s chief operating officer, Chuck Harry. “So, despite the markets’ still relatively low occupancy levels in general, operators effectively have managed to push rates upward in light of the increased operating costs.”
Occupancy increased for assisted living, independent living, and nursing care properties in NIC MAP’s Primary Markets:
- Assisted living occupancy increased to 78.3%, up from its pandemic low of 75.4% in the first quarter of 2021 but still below its pre-pandemic level of 84.9%. Assisted living had the largest increase among the three property types, rising 1.4 percentage points in the fourth quarter.
- Independent living occupancy increased to 83.6%, up from its pandemic low of 81.8% in the first quarter of 2021 but still below its pre-pandemic level of 89.7%.
- Nursing care occupancy increased to 77.2%, up from its pandemic low of 74.1% in the first quarter of 2021 but still below its pre-pandemic level of 86.6%.
San Jose (86.0%), San Francisco (85.2%), and Boston (85.2%) had the highest senior housing occupancy rates of the 31 metropolitan markets that encompass NIC MAP’s Primary Markets. The markets experiencing the lowest occupancy rates included Houston (74.8%), Cleveland (77.0%), and Atlanta (77.9%).
A summary of the NIC MAP Market Fundamentals Data, released by NIC MAP Vision, is below.
