Chartwell Announces Third Quarter 2021 Results
November 12, 2021
Chartwell Retirement Residences (“Chartwell”) (TSX: CSH.UN) announced today its results for the third quarter ended September 30, 2021.
Highlights
- Occupancy recovery is underway, led by strong growth in Western Canada
- Maintaining strong liquidity (1) position of $338.6 million, which included $86.3 million of cash and cash equivalents at November 11, 2021.
- Same property adjusted net operating income (“NOI”) (1) declined 6.5% in Q3 2021 and funds from operations (“FFO”) (1) down 10.7% in Q3 2021 from Q3 2020 as a result of reduced occupancy and continued investments in resident care and infection prevention and control measures.
“Following continuing improvements in our leading sales indicators, we are now seeing occupancy recovery gradually taking hold, led by strong improvements in Western Canada. We forecast our December same property portfolio occupancy to improve to 76.8% from 76.3% in July. To continue to protect our residents, their families, and our staff, effective October 12, 2021, we made COVID-19 vaccinations mandatory for all our staff in Ontario and Western Canada, and will be effective November 15, 2021, for all our staff in Quebec. We feel privileged to serve our residents and will continue to provide the best care and services possible to ensure their safety and wellbeing,” commented Vlad Volodarski, CEO. “I am confident with the strength and ingenuity of our Chartwell people, driven by our vision of Making People’s Lives Better, our innovative marketing and sales programs, combined with the accelerated growth of the senior’s population and slow-down of new construction starts in our markets, we will recover our occupancies and continue to create sustainable value for all our stakeholders over time.”
|
Three Months Ended September 30 |
Nine Months Ended September 30 |
|||||||
|
($000s, except per unit amounts and number of units) |
2021 |
2020 |
2021 |
2020 |
||||
|
Resident revenue |
$ |
211,536 |
$ |
219,650 |
$ |
639,466 |
$ |
654,932 |
|
Direct property operating expense |
$ |
155,633 |
$ |
160,482 |
$ |
467,113 |
$ |
466,118 |
|
Net income/(loss) |
$ |
917 |
$ |
(6,766) |
$ |
(8,600) |
$ |
2,697 |
|
FFO (1) |
$ |
33,937 |
$ |
37,997 |
$ |
103,828 |
$ |
122,366 |
|
FFO per unit (1) |
$ |
0.15 |
$ |
0.17 |
$ |
0.47 |
$ |
0.56 |
|
Weighted average number of units outstanding (000s) (2) |
225,074 |
218,268 |
220,673 |
218,004 |
||||
Resident revenue decreased $8.1 million or 3.7% in Q3 2021 primarily due to disposition of properties and occupancy decline in our existing property portfolio.
Direct property operating expense decreased $4.8 million or 3.0% in Q3 2021 primarily due to disposition of properties and lower expenses in our long term care same property portfolio.
In Q3 2021, net income was $0.9 million compared to net loss of $6.8 million in Q3 2020. The change in net income/(loss) in Q3 2021 was primarily due to lower direct property operating expense, lower depreciation of property, plant and equipment (“PP&E”), lower finance costs, positive changes in fair value of financial instruments, and loss on disposal of assets in Q3 2020, partially offset by lower resident revenue.
In Q3 2021, FFO decreased $4.1 million primarily due to lower occupancy, decrease in contributions from our acquisitions, development, and other portfolio, primarily due to sales of non-core properties, and lower interest income, partially offset by lower finance costs and higher management fee revenue.
For 2021 YTD, resident revenue decreased $15.5 million or 2.4%, primarily due to disposition of properties and occupancy decline in our existing property portfolio.
For 2021 YTD, direct property operating expense increased $1.0 million or 0.2%, primarily due to higher expenses in our existing property portfolio, partially offset by the disposition of properties.
For 2021 YTD, net loss was $8.6 million compared to net income of $2.7 million in 2020 YTD. The change in 2021 YTD net income/(loss) was primarily due to lower resident revenue, higher direct property operating expenses, negative changes in fair values of financial instruments, and lower deferred tax benefit, partially offset by lower depreciation of PP&E, lower finance costs, higher gain on disposal of assets, and absence of impairment charges in 2021 YTD as compared to 2020 YTD.
For 2021 YTD, FFO decreased $18.5 million primarily due to lower occupancy, continued investments in resident care and infection prevention and control measures, decrease in contributions from our acquisitions, development, and other portfolio, primarily due to sales of non-core properties and lower interest income, partially offset by lower finance costs, lower G&A expenses, lower depreciation of PP&E and amortization of intangible assets used for administrative purposes and higher management fees.
Operating Performance
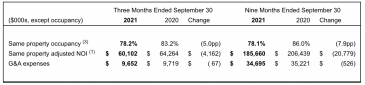
In Q3 2021, same property occupancy was lower than Q3 2020 by 5.0 percentage points. Compared to Q2 2021, occupancy in our retirement same property platform decreased 0.1 percentage points. Our Western Canada platform achieved strong growth recovering 1.9 percentage point of occupancy, and Ontario experienced a small decline of 0.2 percentage points. Occupancies in our Quebec platform, which has a more independent clientele and where restrictions on retirement residences were the most stringent, declined by 1.3 percentage points. Compared to Q2 2021, same property occupancy, in our Long Term Care Operations also increased.
In Q3 2021, same property adjusted NOI (1) decreased $4.2 million or 6.5% primarily due to lower occupancy, higher repairs and maintenance, insurance, and utilities expenses, partially offset by inflationary and market-based rental and service rate increases, higher revenue from the provision of additional care and services, and government reimbursement to partially defray pandemic-related expenses.
In Q3 2021, G&A expenses decreased $0.1 million due to lower non-cash compensation costs as a result of changes in fair value of our Trust Units.
For 2021 YTD, same property occupancy declined 7.9 percentage points. Although move-ins have significantly rebounded compared to 2020 YTD, and move-outs remain slightly below pre-pandemic levels, move-ins were lower than move-outs, which resulted in declining occupancy.
For 2021 YTD, same property adjusted NOI (1) decreased $20.8 million or 10.1%, primarily due to lower occupancy, higher staffing costs, repairs and maintenance, and insurance expenses, partially offset by inflationary and market-based rental and service rate increases, reimbursements to partially defray pandemic-related expenses, and lower net pandemic expense.
For 2021 YTD, G&A expenses decreased $0.5 million in 2021 YTD, as 2020 YTD included a $0.6 million contribution to support the Senior Living CaRES Fund and due to lower education and travel expenses. This was partially offset by higher non-cash compensation costs as a result of changes in fair value of our Trust Units.
Financial Position
At September 30, 2021, liquidity (1) amounted to $317.3 million, which included $65.0 million of cash and cash equivalents and $252.3 million of available borrowing capacity on our credit facilities. In addition, Chartwell’s share of cash and cash equivalents held in its equity-accounted joint ventures was $7.5 million.
The interest coverage ratio (1) on a rolling 12-month basis remained strong at 2.9 at September 30, 2021 compared to 2.9 at December 31, 2020. The net debt to adjusted EBITDA ratio (1) at September 30, 2021 was 9.6 compared to 9.4 at December 31, 2020.
Additionally, our unencumbered asset pool value was $1.0 billion at September 30, 2021, and our encumbered property asset value to unsecured indebtedness ratio increased to 2.1 at September 30, 2021.
Recent Developments
Significant progress has been made in both vaccination programs for our residents and for our employees with substantially all of our residents and employees fully vaccinated. We have implemented a mandatory vaccination policy for all of our residences.
There are currently four COVID-19 outbreaks in our residences. Both outbreaks and their relative impact, have significantly lessened as compared to the first year of the pandemic. As a result, our extensive investments in additional personal protective equipment and staffing are returning to normalized levels. Our response to the pandemic has been and continues to be guided by public health authorities and the Federal, Provincial and Municipal governments. We continue to meet or exceed the direction provided by these authorities to control the spread of COVID-19.
The following table summarizes monthly weighted average occupancy rates in our Retirement Operations:
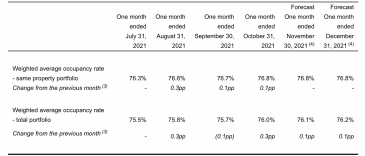
The pandemic and related government and health authority restrictions and directives have resulted in decreased occupancy levels due to reduced move-in activity in our retirement residences compared to pre-pandemic levels. The pandemic-related restrictions and directives included restrictions affecting resident move-ins, prospect tours, dining services, group activities, housekeeping, visitation, and both short- and long-term leaves, among others. With the large-scale successful vaccination program, pandemic-related restrictions in both our residences and the communities in which we operate continue to ease. Current Public Health Agency of Canada modelling projects that pandemic-related restrictions can continue to be gradually lifted and that, with public health measures like vaccine passports and masking mandates remaining in place through the fall and winter, hospital capacity will not likely be exceeded. As a result, we believe there is a low likelihood of these pervasive restrictions needing to be reintroduced.
Commencing in early summer of 2021, these restrictions have been significantly reduced, and we have seen increases in personal tour bookings, lease signings, and permanent move-ins.
In August 2021, our occupancy increased, led by our Western platform. Our Quebec residences have continued to experience declines in occupancy. We believe that if pandemic-related restrictions continue to ease, move-ins will continue recovering and occupancies in our retirement residences will continue to grow in 2022, supported by demographic growth, pent-up demand, and lower new retirement residence openings relative to historic levels.
On October 19, 2021, we entered into a definitive agreement to sell four non-core retirement residences (302 suites) located in Ontario for an aggregate sale price of $71.5 million with estimated transaction costs of $1.8 million. The mortgages on these properties of approximately $14.2 million will be discharged on closing. The transaction is expected to be completed before December 31, 2021.
At November 11, 2021, we have $22.2 million of mortgage maturities remaining in 2021, of which $3.5 million are CMHC insured. We have $204.5 million of mortgage maturities in 2022, of which $74.9 million are CMHC insured. In addition, there are $15.1 million of remaining 2021 mortgage maturities and $10.9 million of 2022 mortgage maturities in our equity-accounted joint ventures. We have strong lending relationships and scheduled refinancings of our mortgage maturities in 2021 and 2022 are proceeding in the normal course.
At November 11, 2021, liquidity (1) amounted to $338.6 million, which included $86.3 million of cash and cash equivalents and $252.3 million of available borrowing capacity on our credit facilities. In addition, Chartwell’s share of cash and cash equivalents held in our equity-accounted joint ventures was $15.4 million. In addition, at November 11, 2021, our unencumbered asset pool value is $1.0 billion.
Investor Conference Call
A conference call hosted by Chartwell’s senior management team will be held Friday, November 12, 2021, at 10:00 AM ET. The telephone numbers for the conference call are: Local: (416) 340-2217 or Toll Free: 1-800-898-3989. The passcode for the conference call is: 1251063#. The conference call can also be heard over the Internet by accessing the Chartwell website at www.chartwell.com, clicking on “Investor Relations” and following the link at the top of the page. A slide presentation to accompany management’s comments during the conference call will be available on the website. Please log on at least 15 minutes before the call commences.
The telephone numbers to listen to the call after it is completed (Instant Replay) are: Local (905) 694-9451 or Toll-Free: 1-800-408-3053. The Passcode for the Instant Replay is 8361479#. These numbers will be available for 90 days following the call. An audio file recording of the call, along with the accompanying slides, will also be archived on the Chartwell website at www.chartwell.com.
|
Footnotes |
|
|
(1) |
FFO, FFO per unit, same property adjusted NOI, adjusted NOI, liquidity, interest coverage ratio, and net debt to adjusted EBITDA ratio are measures used by management in evaluating operating and financial performance. Please refer to the cautionary statements under the heading “Non-GAAP Financial Measures” in this press release. |
|
(2) |
Includes Trust Units, Class B Units of Chartwell Master Care LP, and Trust Units issued under Executive Unit Purchase Plan and Deferred Trust Unit Plan. |
|
(3) |
‘pp’ means percentage points. |
|
(4) |
Forecast includes leases and notices as at November 4, 2021. |